May 12, 2025 Firm News
Las Vegas is an international tourist destination. The resort, gaming, entertainment, and hospitality scenes attract millions of visitors from around the world each year. This concentration of intense tourism, high-density commercial development, and large-scale events results in significant congestion in certain areas, most notably the Strip. In fact, the intersection of Las Vegas Boulevard and Tropicana is one of the busiest intersections in the world. Does this congestion, along with other potential traffic safety hazards, create dangerous situations for drivers and passengers?At the Janda Law Firm, we examined the data to find out.
In this study, we analyzed motor vehicle collisions within close proximity to casinos to identify areas and properties where crashes and injuries occur most often. If you are in need of a Las Vegas accident lawyer, we of course can help, but the purpose of this study is to actually create awareness and hopefully prevent more accidents in Las Vegas. By helping us create more awareness, it’s possible that we can help prevent someone from being injured or even save lives.
We looked at both crash and injury frequency along with collision density to quantify and contextualize the safety dynamics of this unique urban landscape, providing insights that could inform urban planning, transportation safety strategies, and risk mitigation approaches.
*Note: crashes on major highways were excluded in our analysis.
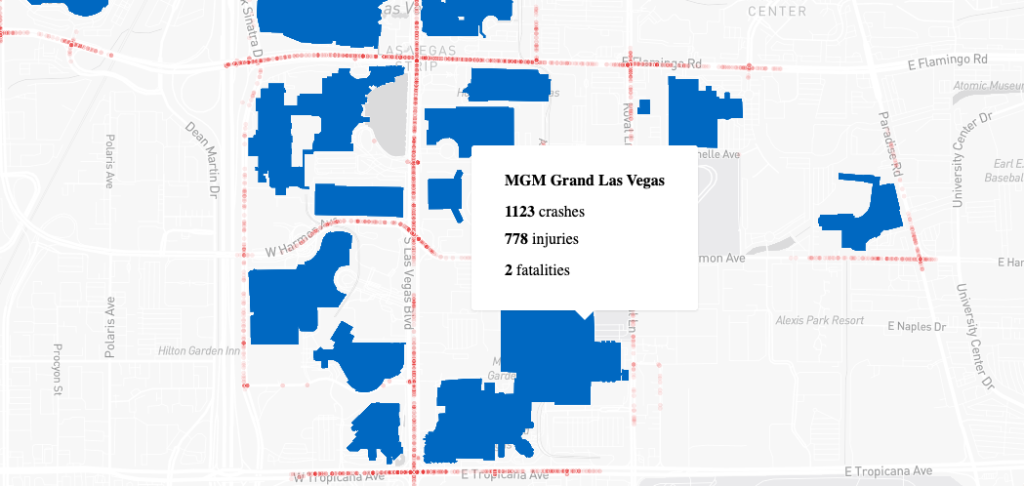
The map below is interactive. It shows collision activity on the streets around each casino. Hover over the center of each shape for more detailed information about each one.
As you might expect, larger casino properties tended to see more crashes than smaller ones. In fact, 11 of the top 15 (and all of the top five) highest crash counts belong to casinos on the strip.
Despite the high crash counts, on-strip and downtown Las Vegas Casinos had lower injury rates than those found off-strip, despite the significant traffic and tourism volume. This may be due to the infrastructure improvement in the Las Vegas strip and downtown areas, particularly geared towards protecting pedestrians.
This includes the installation of pedestrian bridges, traffic calming measures, sidewalk expansions, and – in downtown – the conversion of Fremont Street into a pedestrian mall.
As outlined in our key findings, 8 of the 10 casinos with the highest injury rates were off-strip, led by Arizona Charlie’s Decatur with the highest injury rate of any casino in the study.
According to Founding Attorney Paul Janda, the findings in this study are about awareness and understanding, not necessarily problems with the city road network.
“Las Vegas is a special place where entertainment, tourism, and the lives of locals intersect in unique ways. Our research provides context and reveals areas where collisions and subsequent injuries may be more likely to occur.” Janda said.
“These findings aren’t about assigning blame, but about understanding the situation and providing a resource for locals and visitors alike. If this information helps even one person avoid a collision or get home safely, then it’s worth it.”
Below, we list all casinos included in this study, along with the crashes, injuries, and deaths near the property. The injury rate is per 100 crashes, while the crash density represents crashes per 100,000 square feet.
| Rank | Casino | Crashes | Injuries | Deaths | Injury Rate | Crash Density |
|---|---|---|---|---|---|---|
| 1 | MGM Grand Las Vegas | 1123 | 778 | 2 | 69.28 | 1.79 |
| 2 | Bellagio Las Vegas | 1091 | 538 | 0 | 49.31 | 2.42 |
| 3 | Caesars Palace | 1089 | 536 | 3 | 49.22 | 2.92 |
| 4 | Treasure Island Las Vegas | 953 | 489 | 1 | 51.31 | 4.08 |
| 5 | The Venetian Resort Las Vegas | 945 | 539 | 2 | 57.04 | 2.17 |
| 6 | Flamingo Las Vegas | 871 | 495 | 1 | 56.83 | 3.10 |
| 7 | Sahara Las Vegas | 859 | 561 | 3 | 65.31 | 2.72 |
| 8 | New York New York Las Vegas Hotel and Casino | 722 | 368 | 0 | 50.97 | 3.37 |
| 9 | Gold Spike | 717 | 509 | 2 | 70.99 | 5.57 |
| 10 | El Cortez Hotel and Casino | 639 | 429 | 0 | 67.14 | 3.58 |
| 11 | Palace Station Hotel and Casino | 605 | 417 | 0 | 68.93 | 1.83 |
| 12 | Excalibur Hotel and Casino Las Vegas | 576 | 316 | 1 | 54.86 | 2.03 |
| 13 | The Cosmopolitan of Las Vegas | 557 | 319 | 1 | 57.27 | 2.39 |
| 14 | Wynn Las Vegas | 550 | 281 | 1 | 51.09 | 1.82 |
| 15 | Downtown Grand Hotel and Casino | 545 | 395 | 2 | 72.48 | 3.03 |
| 16 | Planet Hollywood Resort and | 538 | 298 | 1 | 55.39 | 2.84 |
| 17 | Paris Las Vegas | 531 | 311 | 1 | 58.57 | 2.07 |
| 18 | Red Rock Casino Resort Spa | 525 | 364 | 1 | 69.33 | 1.02 |
| 19 | Mandalay Bay | 496 | 333 | 1 | 67.14 | 0.78 |
| 20 | Luck Club Hotel and Casino Las Vegas | 481 | 263 | 2 | 54.68 | 2.97 |
| 21 | Rio Hotel and Casino | 432 | 297 | 2 | 68.75 | 1.27 |
| 22 | Durango Casino and Resort | 420 | 324 | 2 | 77.14 | 0.88 |
| 23 | Sam’s Town Hotel and Gambling Hall | 416 | 330 | 3 | 79.33 | 1.04 |
| 24 | Horseshoe Las Vegas | 401 | 260 | 0 | 64.84 | 1.85 |
| 25 | Boulder Station Hotel and Casino | 398 | 329 | 5 | 82.66 | 0.94 |
| 26 | Binion’s Gambling Hall and Hotel | 381 | 245 | 2 | 64.30 | 2.82 |
| 27 | Palms | 365 | 340 | 2 | 93.15 | 0.98 |
| 28 | Golden Nugget Las Vegas | 363 | 206 | 1 | 56.75 | 1.76 |
| 29 | Fremont Hotel and Casino | 363 | 205 | 3 | 56.47 | 2.40 |
| 30 | Tuscany Suites and Casino | 341 | 286 | 2 | 83.87 | 1.13 |
| 31 | Cannery Casino and Hotel | 322 | 202 | 1 | 62.73 | 0.78 |
| 32 | Gold Coast Hotel and Casino | 320 | 255 | 1 | 79.69 | 1.31 |
| 33 | California Hotel and Casino | 311 | 214 | 2 | 68.81 | 2.40 |
| 34 | South Point Hotel Casino and Spa | 302 | 185 | 3 | 61.26 | 0.61 |
| 35 | Virgin Hotels Las Vegas | 287 | 208 | 2 | 72.47 | 0.88 |
| 36 | Circa Resort and Casino | 287 | 182 | 2 | 63.41 | 2.52 |
| 37 | Plaza Hotel and Casino | 280 | 233 | 3 | 83.21 | 0.80 |
| 38 | Ellis Island Casino and Hotel | 253 | 198 | 0 | 78.26 | 2.09 |
| 39 | The Mirage | 246 | 164 | 1 | 66.67 | 0.56 |
| 40 | Wildfire by Station Casinos | 227 | 91 | 0 | 40.09 | 1.66 |
| 41 | Circus Circus Las Vegas | 218 | 185 | 0 | 84.86 | 0.62 |
| 42 | The Orleans Hotel and Casino Las Vegas | 215 | 163 | 0 | 75.81 | 0.68 |
| 43 | Resorts World Las Vegas | 209 | 165 | 1 | 78.95 | 0.55 |
| 44 | The Strat Hotel, Casino and Tower | 197 | 133 | 1 | 67.51 | 0.63 |
| 45 | Encore Las Vegas | 194 | 165 | 3 | 85.05 | 0.63 |
| 46 | Jerry’s Nugget Casino | 193 | 133 | 0 | 68.91 | 0.74 |
| 47 | Golden Gate Hotel and Casino | 179 | 122 | 2 | 68.16 | 2.15 |
| 48 | Park MGM Las Vegas | 177 | 91 | 0 | 51.41 | 0.72 |
| 49 | Aria Resort and Casino | 175 | 129 | 0 | 73.71 | 0.51 |
| 50 | OYO Hotel and Casino | 151 | 158 | 1 | 104.64 | 0.76 |
| 51 | Main Street Station Casino Brewery Hotel | 148 | 109 | 3 | 73.65 | 0.64 |
| 52 | The Linq Hotel and Casino | 144 | 89 | 1 | 61.81 | 0.80 |
| 53 | Cannery Casino and Hotel | 137 | 124 | 1 | 90.51 | 0.33 |
| 54 | Santa Fe Station Hotel and Casino | 131 | 82 | 1 | 62.60 | 0.47 |
| 55 | Harrah’s Las Vegas | 130 | 71 | 1 | 54.62 | 0.71 |
| 56 | Silverton Casino Lodge | 130 | 70 | 0 | 53.85 | 0.52 |
| 57 | Best Western Plus Casino Royale – Center Strip | 126 | 68 | 1 | 53.97 | 1.08 |
| 58 | Arizona Charlie’s Decatur | 106 | 133 | 1 | 125.47 | 0.57 |
| 59 | Longhorn Hotel and Casino | 106 | 93 | 1 | 87.74 | 0.75 |
| 60 | Mardi Gras Hotel & Casino | 94 | 70 | 0 | 74.47 | 0.43 |
| 61 | Rainbow Club Casino | 88 | 29 | 1 | 32.95 | 0.66 |
| 62 | Aliante Casino and Hotel | 82 | 50 | 1 | 60.98 | 0.30 |
| 63 | Jokers Wild Casino | 76 | 37 | 1 | 48.68 | 0.46 |
| 64 | Emerald Island Casino | 74 | 27 | 0 | 36.49 | 0.51 |
| 65 | Luxor Las Vegas | 57 | 33 | 1 | 57.89 | 0.25 |
| 66 | Skyline Hotel and Casino | 55 | 28 | 1 | 50.91 | 0.32 |
| 67 | Bonanza Lounge and Casino | 48 | 46 | 0 | 95.83 | 0.36 |
| 68 | The Pass Casino | 48 | 13 | 1 | 27.08 | 0.29 |
| 69 | Arizona Charlie’s Boulder | 44 | 35 | 1 | 79.55 | 0.26 |
| 70 | Barley’s Casino and Brewing Company | 40 | 19 | 0 | 47.50 | 0.23 |
| 71 | Rampart Casino | 36 | 14 | 0 | 38.89 | 0.14 |
| 72 | Westgate Resort Las Vegas | 22 | 13 | 1 | 59.09 | 0.06 |
| 73 | M Resort Spa Casino | 16 | 4 | 0 | 25.00 | 0.06 |
| 74 | Suncoast Hotel and Casino | 11 | 7 | 0 | 63.64 | 0.05 |
| 75 | Green Valley Ranch | 9 | 2 | 0 | 22.22 | 0.03 |
| 76 | Club Fortune Casino | 7 | 3 | 0 | 42.86 | 0.05 |
| 77 | Railroad Pass Hotel and Casino Ramada by Wyndham | 2 | 1 | 0 | 50.00 | 0.01 |
This study is based on collision data from the Nevada Department of Transportation from 2018 through March 2025.
Casino shapes were sourced from the Open Street Map. We excluded slots-only gaming parlors and casinos with more than one location.
Collision counts were calculated by assigning a buffer around each casino. As many resorts and casinos are in close proximity to one another, a single crash may be counted in more than one casino’s zone.
If you’d like to share or report on our findings, please provide a link back to this study as attribution.